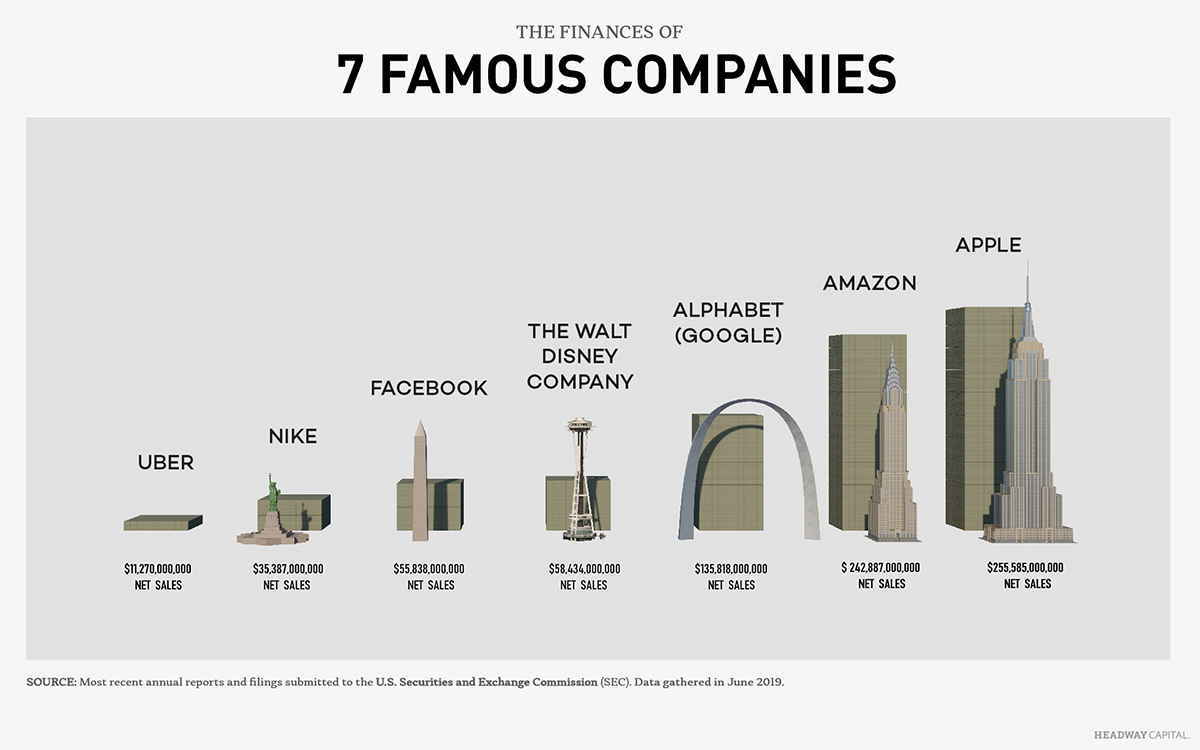
The Finances of 7 Famous Companies, Visualized
For most consumer-facing companies, profit is a product of two factors: revenue and expenses. Revenue is the income generated by the sale or rental of a company’s goods and services, as well as income earned through investment. Expenses generally include the cost of goods sold — the parts and labor required to make a product — as well as marketing expenses, administrative expenses, and investments in research and development.
To better understand the business models of today’s most dominant corporations, Headway Capital analyzed the SEC filings and annual reports of seven major companies. Using data for the most recent fiscal year, we visualized their income statements as alluvial diagrams, showing the inflow of revenues, the outflow of costs, and, ultimately, the profits or losses that result.
The largest, most dominant companies in the world today are not necessarily the most profitable. In an attempt to establish a recurring revenue stream in the long term, some companies will sacrifice short-term profit and reinvest most of their income on customer acquisition and supply chain infrastructure. This tradeoff between growth and profit is often visually apparent in a company’s income alluvial.
How the money flows through 7 companies
Amazon, for example, has strongly favored growth over profits, reinvesting much of its revenue in improvements to its last-mile delivery infrastructure, the expansion of its Prime membership base, and the development of new business ventures. The e-commerce giant did not turn a profit until Q4 2001, and has had several unprofitable quarters since. Uber has also reported heavy operating losses, reinvesting much of its revenue on driver and customer acquisition in new cities as well as research and development on new technologies.
Meanwhile, Apple, having developed a strong demand for its line of premium-priced products, is largely focused on profits. Despite the iPhone accounting for less than 20% of global smartphone market share, Apple takes home approximately 87% of the smartphone industry’s profits. Apple’s net profit amounted to 22.4% of its operating revenue in fiscal 2018, compared to 4.3% for Amazon.
What Amazon does with its revenue
Despite bringing in $232.9 billion in revenue in 2018, Amazon reported only $10.1 billion in net profit for the year — one of the lowest margins of any major tech company. While the company’s low profit margins may have turned off some early investors, Amazon’s focus on growth over profits is starting to pay off. Amazon Web Services, the company’s cloud computing venture, generated $25.7 billion in revenue in 2018 and made up a bulk of Amazon’s net profit.
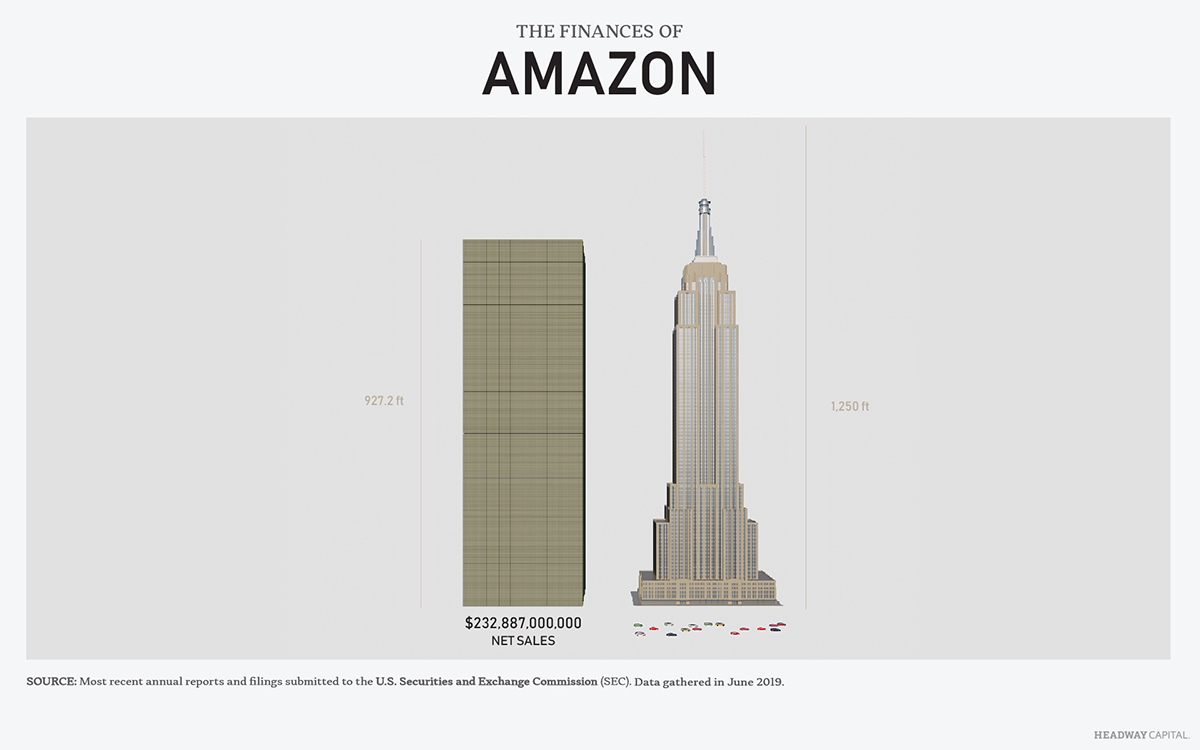
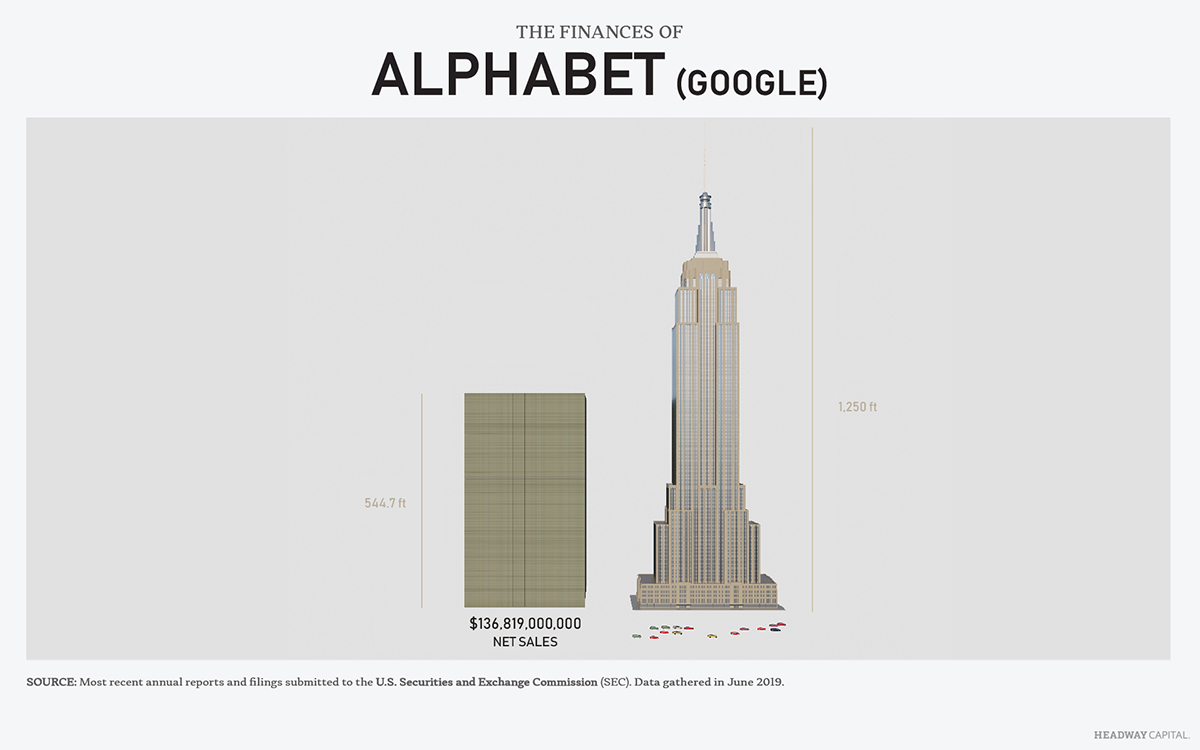
Click on the chart to see how the net sales compare to the Empire State Building
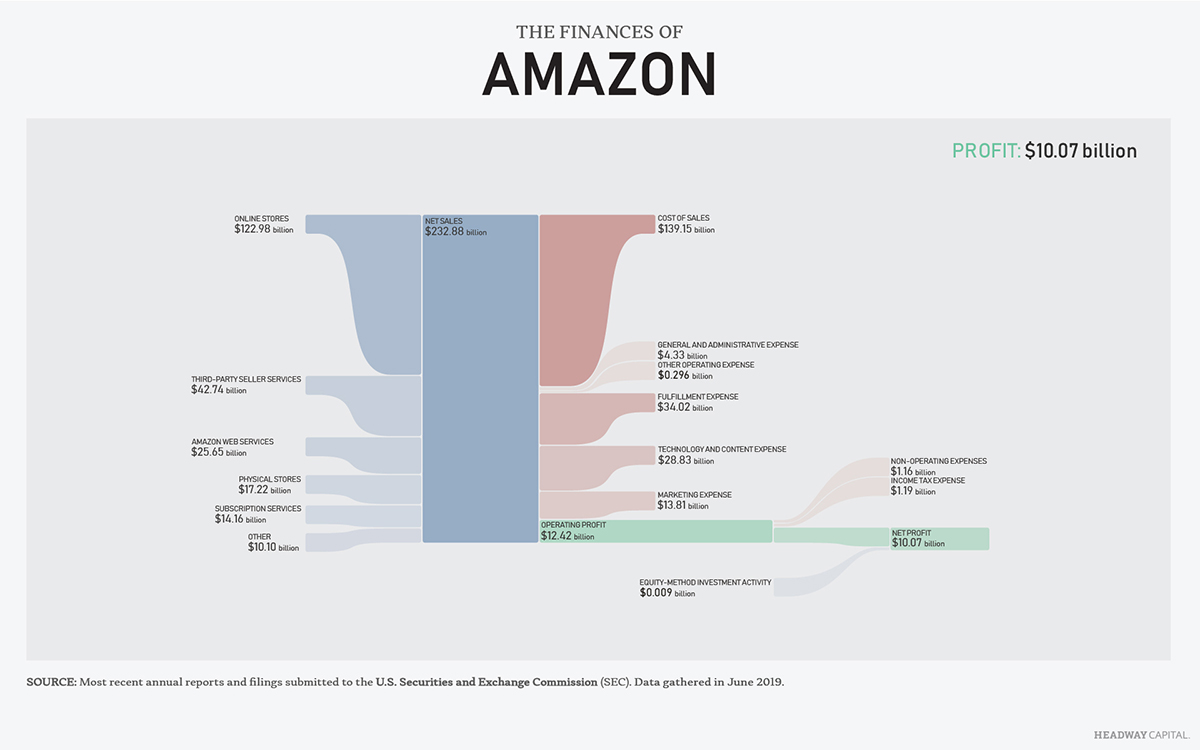
Driven by the acquisition of Whole Foods in August 2017, Amazon’s physical stores — which also include Amazon Books stores, Amazon 4-Star outlets, Amazon Pop-Up sites, and nine cashier-less Amazon Go stores — generated $17.2 billion in revenue last year. The “Other” revenue category, which is largely comprised of Amazon’s advertising business, reported $10.1 billion in revenue, making Amazon Media Group the third largest digital media property after Facebook and Google.
What Alphabet (Google) does with its revenue
In 2015, Google restructured and became Alphabet. While Google still constitutes 99.6% of Alphabet’s revenue, the new structure reflects the company’s evolution from search engine to conglomerate, and its expansion into emerging technologies and new, R&D-heavy business ventures. Alphabet spent $21.4 billion on research and development in 2018, a 28.8% increase from the year prior and among the highest R&D expenditure of any U.S. company. The company’s “Other Bets” segment, which is composed of non-search ventures such as equity investment fund CapitalG, self-driving car unit Waymo, and drone-delivery project Wing, generated $595 million in revenue in 2018, a 23.4% increase.
Click on the chart to see how the net sales compare to the Empire State Building
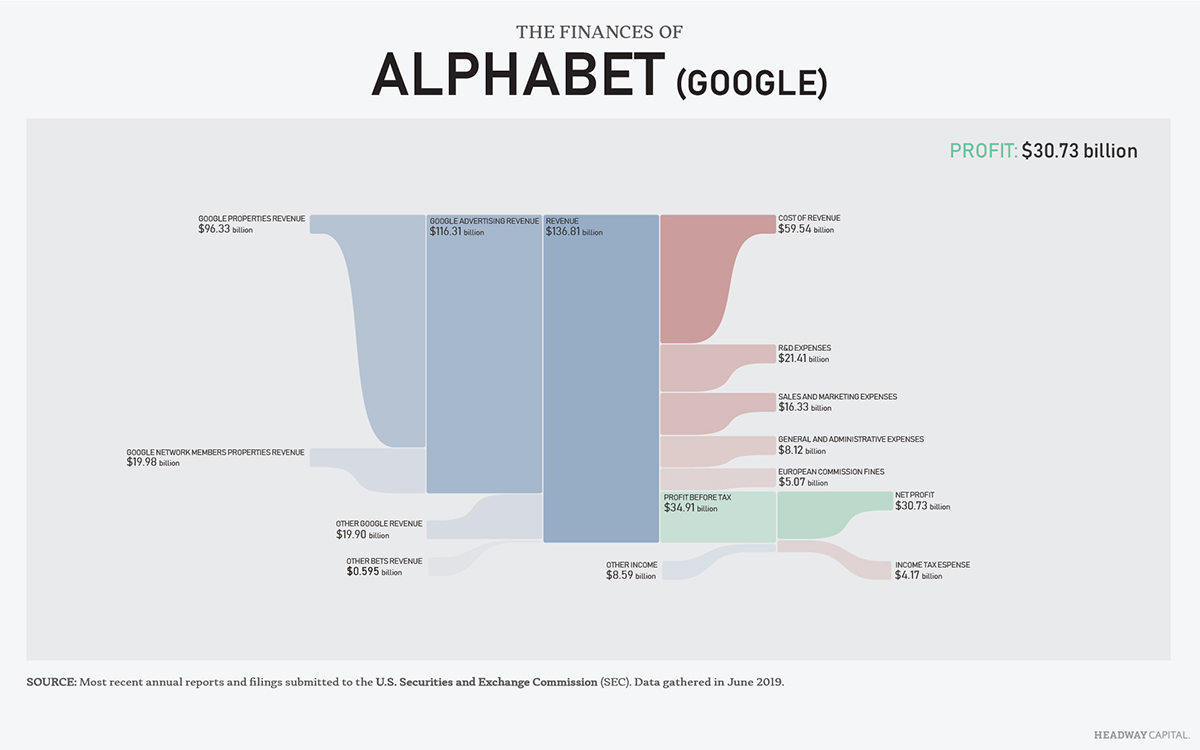
Alphabet’s annual report also highlights budding risks to the company’s growth. In July 2018, the European Union levied a $5.1 billion antitrust fine on Alphabet, amounting to 3.7% of the company’s annual revenue. The EU’s crackdown on Google has potential to threaten the company’s dominance in mobile advertising, and reflects the growing call by lawmakers for regulation of the world’s tech giants.
What Apple does with its revenue
Since its founding in 1976, Apple has been successful in carving out a luxury niche in the consumer tech market and creating substantial demand for highly designed, high-end products sold at premium prices. Today Apple is the most profitable company in the world, posting $59.5 billion in net profit in fiscal 2018.
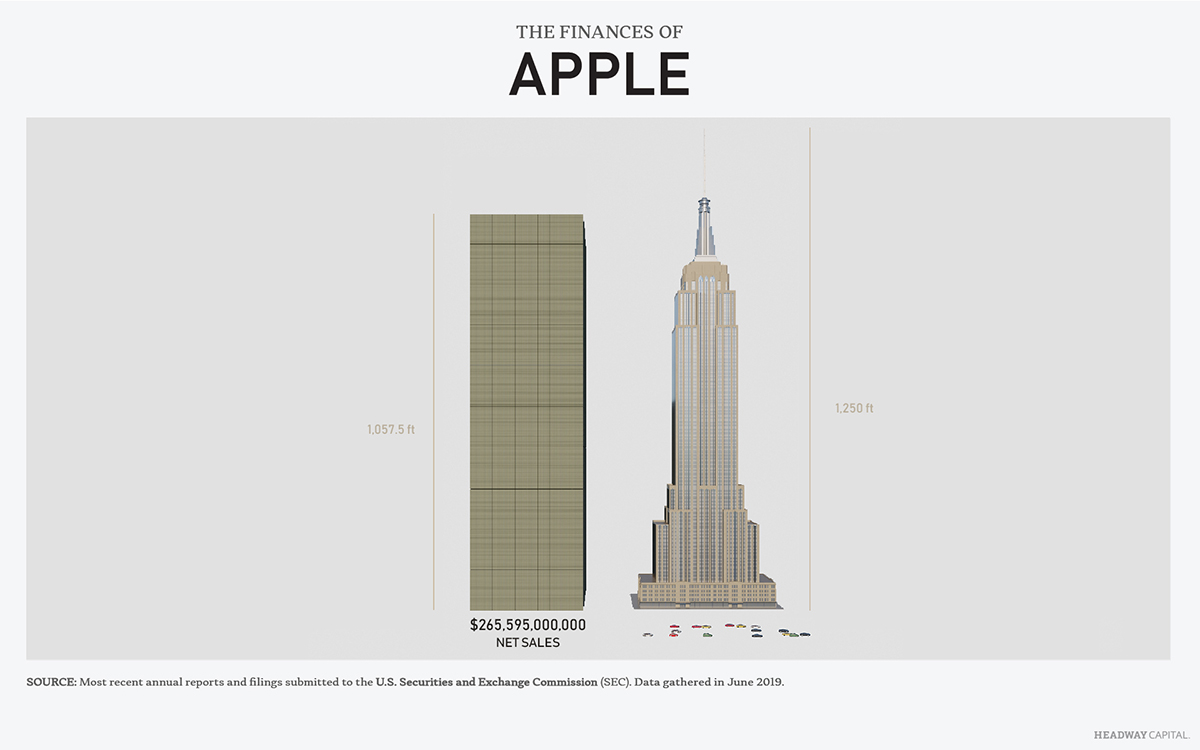
Click on the chart to see how the net sales compare to the Empire State Building
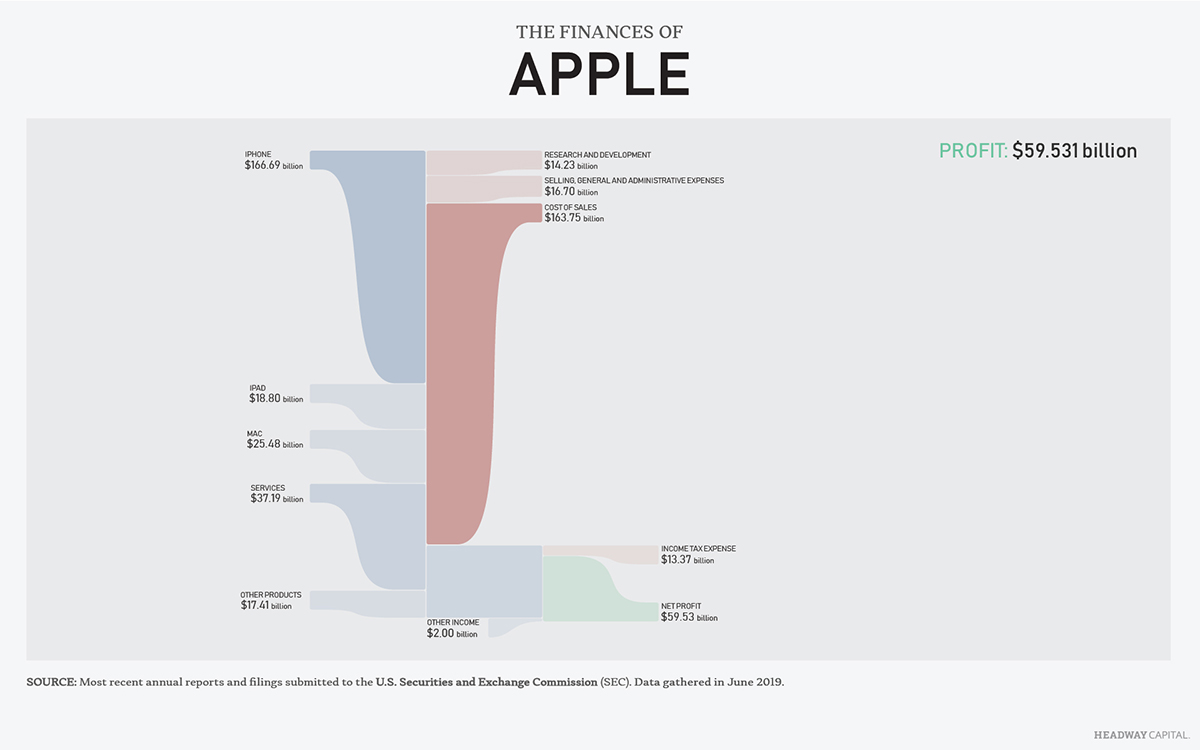
iPhone sales account for a bulk of Apple’s revenue, followed by revenue from services such as app sales, AppleCare, Apple Pay, and licensing. The “Other products” segment includes sales of AirPods, Apple TV, Apple Watch, Beats products, HomePod, iPod touch, and other Apple-branded and third party accessories.
What Facebook does with its revenue
As of March 2019, Facebook has 1.6 billion daily users — approximately one in five people on the planet. The social network’s global scale, combined with its ability to target individuals through the analysis of years of personal content and browsing activity, has created the largest display advertising platform in the world. Facebook reported $55.0 million in advertising revenue in 2018, making up the bulk of its annual revenue. Facebook also reported $826 million in revenue from its money transfer service Payments, and the sale of consumer hardware devices like Portal.
Click on the chart to see how the net sales compare to the Empire State Building
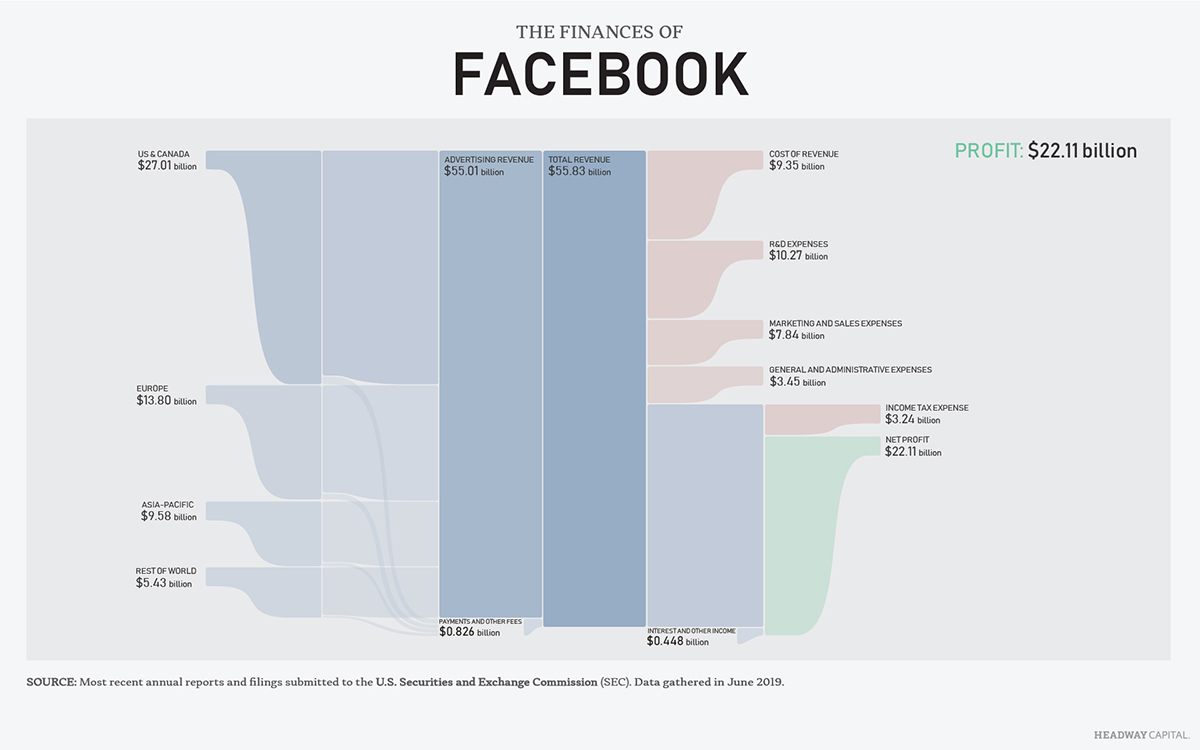
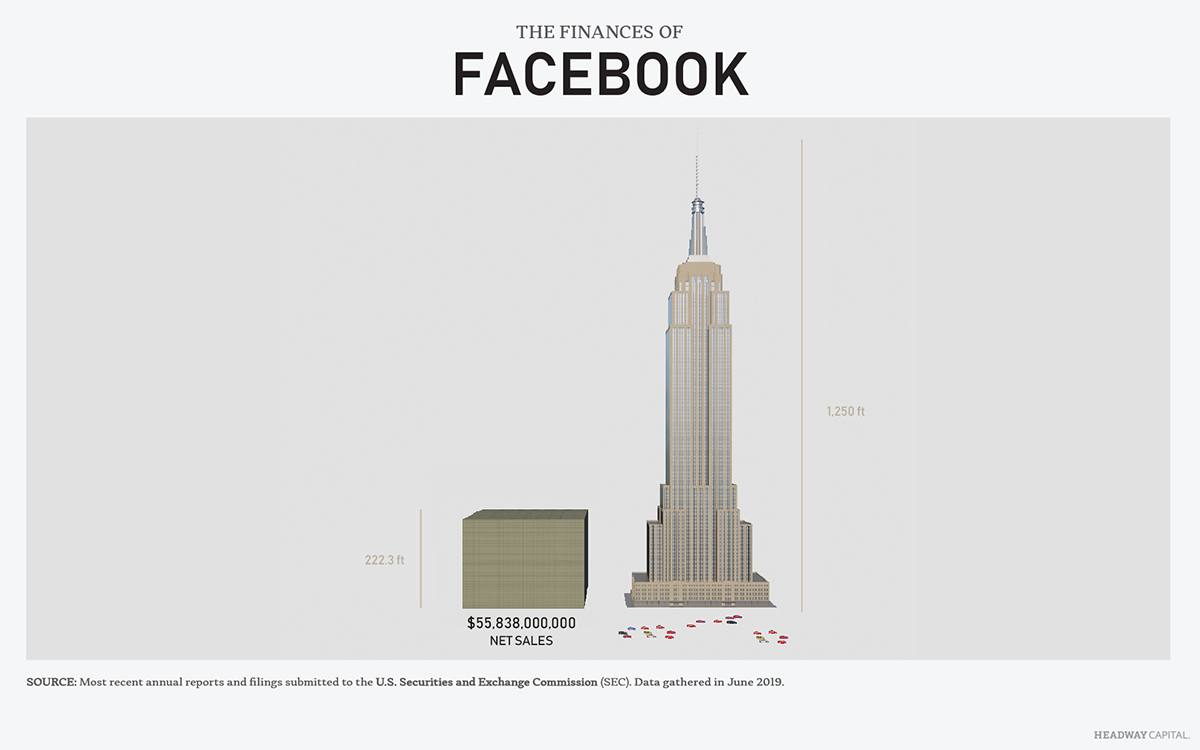
Facebook is one of many tech companies heavily investing in R&D. The Silicon Valley giant spent $10.2 billion on research and development in 2018, a 32.5% increase from the year prior. Facebook’s R&D spending amounts to 18.4% of its revenue, the largest share amongst the Big Four tech companies (Facebook, Apple, Amazon, Google).
What Nike does with its revenue
Nike reported $36.4 billion in revenue in fiscal 2018. A majority of the company’s revenue came from sales of Nike brand footwear, followed by sales of Nike brand apparel and Nike brand equipment. The company also reported revenue from sales of Converse brand products, as well as licensing revenue through its Global Brand Divisions segment, which includes major brands such as Air Jordan and Hurley.
Click on the chart to see how the net sales compare to the Empire State Building
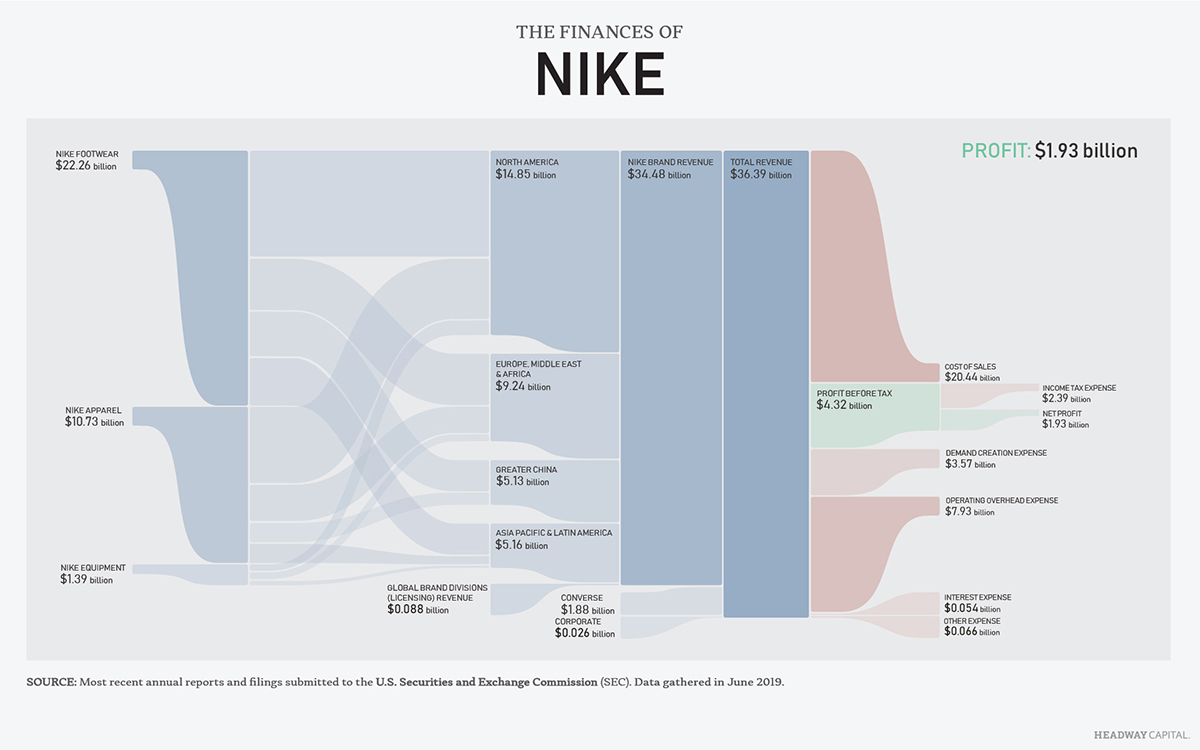
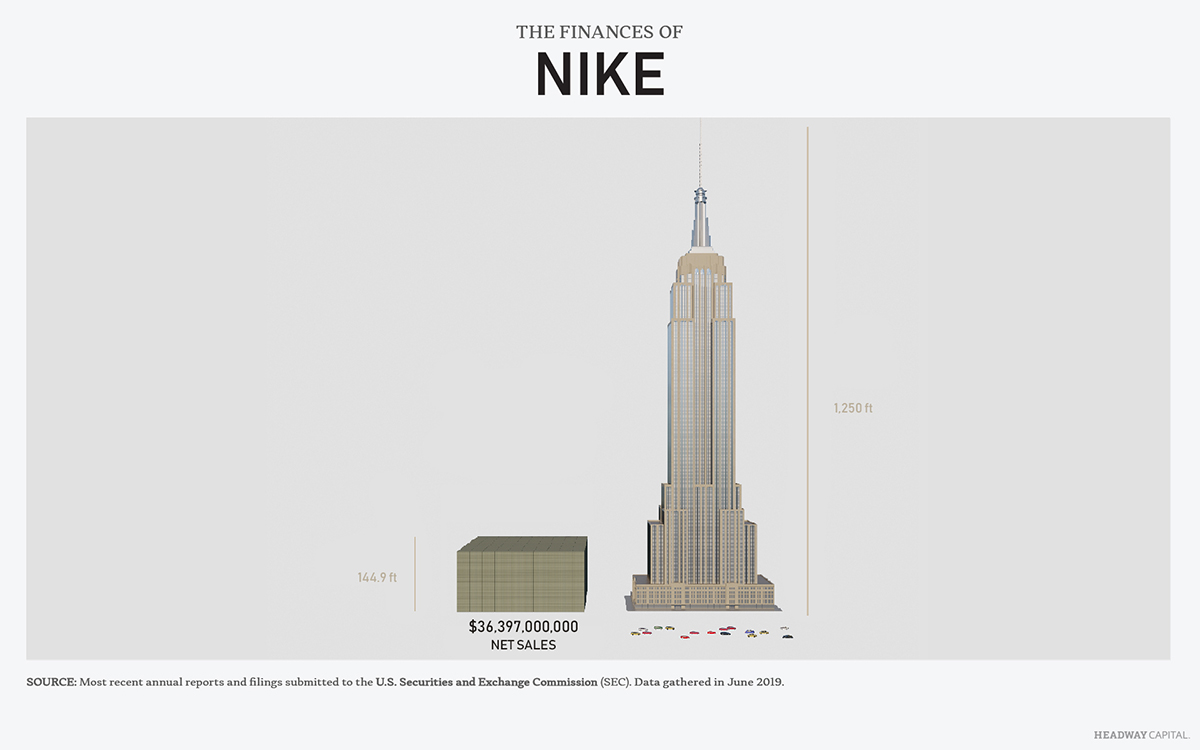
One of Nike’s biggest expenses is the promotion and strengthening of its brand. In fiscal 2018, Nike spent $3.6 billion on “demand creation,” which consists of advertising and promotion costs, including endorsement contracts, television, digital, and print advertising. Nike is also spending more on its physical stores and distribution chain as it attempts to boost its direct-to-consumer retail offerings. Nike spent $7.9 billion on operating overhead in fiscal 2018, a 9.9% increase from the year prior. Some of the spending likely went to the construction of its new Nike Live store, an interactive, smartphone-driven hub for NikePlus members in Los Angeles opened in July 2018.
What Uber does with its revenue
Uber is present in over 700 cities across six continents, servicing approximately 14 million rides every day. Despite generating $9.8 billion in revenue from ride sharing in 2018, as well as $1.5 million from food delivery and $628 million from other operations, Uber operates at a loss. The company incurs significant growth costs when it moves to a new city, shelling out on sign-up bonuses to recruit new drivers and ride discounts help build new customer bases. Uber also invests heavily in R&D, spending
Click on the chart to see how the net sales compare to the Empire State Building
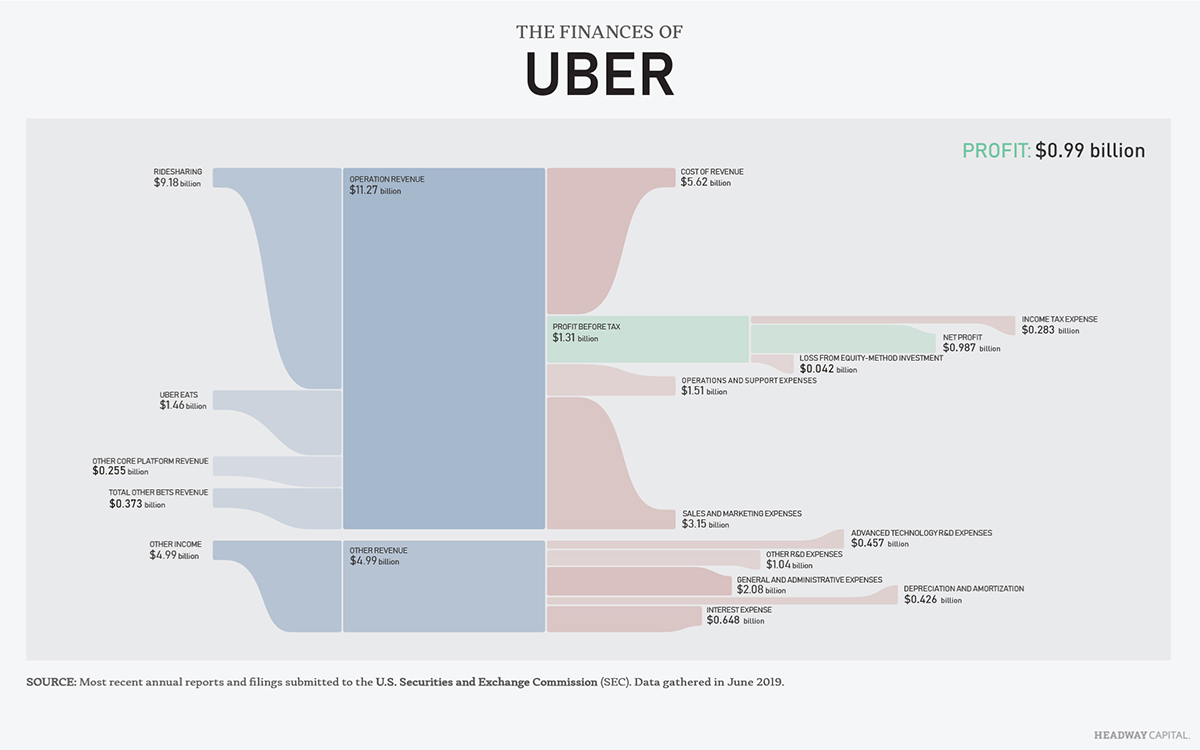
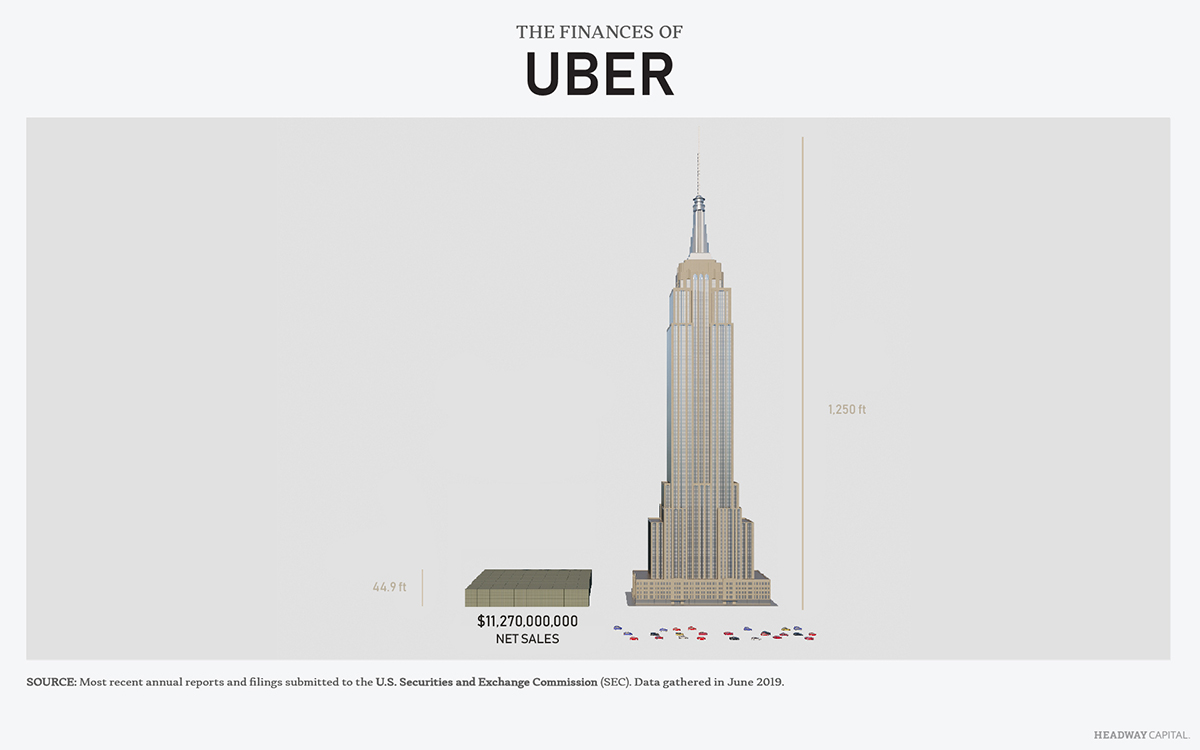
$457 million on self-driving cars and other advanced technology, as well as $1.0 billion in other research and development expenses. While some R&D-heavy ventures, such as Uber Freight, have shown promise in the form of growing revenues — captured in the “Other Bets” segment — investors may not have patience for Uber’s growth-over-profit strategy. Shares of Uber fell 7.6% on the day of its IPO on May 10, 2019, losing a collective $618 million in value — the largest dollar loss in U.S. IPO history going back to 1975.
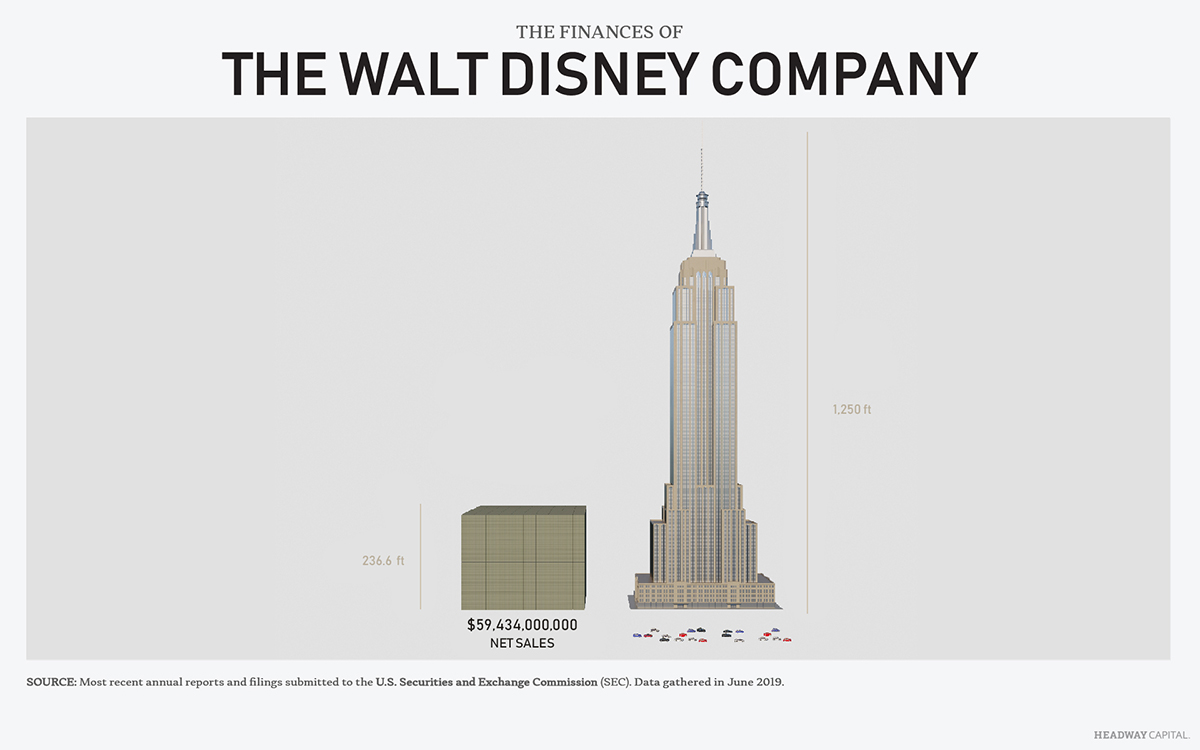
What The Walt Disney Company does with its revenue
A 1957 illustration from the Disney archives highlights the media giant’s business plan: a central catalog of studio films that, through a complex web of arrows representing value creation, both imbues and receives value from other assets such as Disneyland, television, music, and merchandise licensing. While revenue from the company’s studio entertainment segment has since been eclipsed by other business segments — 16.8% of revenue from studio entertainment versus 41.2% from media networks and 34.1% from parks and resorts in fiscal 2018 — Disney’s growth strategy remains relatively consistent with its strategic vision from 60 years ago.
Click on the chart to see how the net sales compare to the Empire State Building
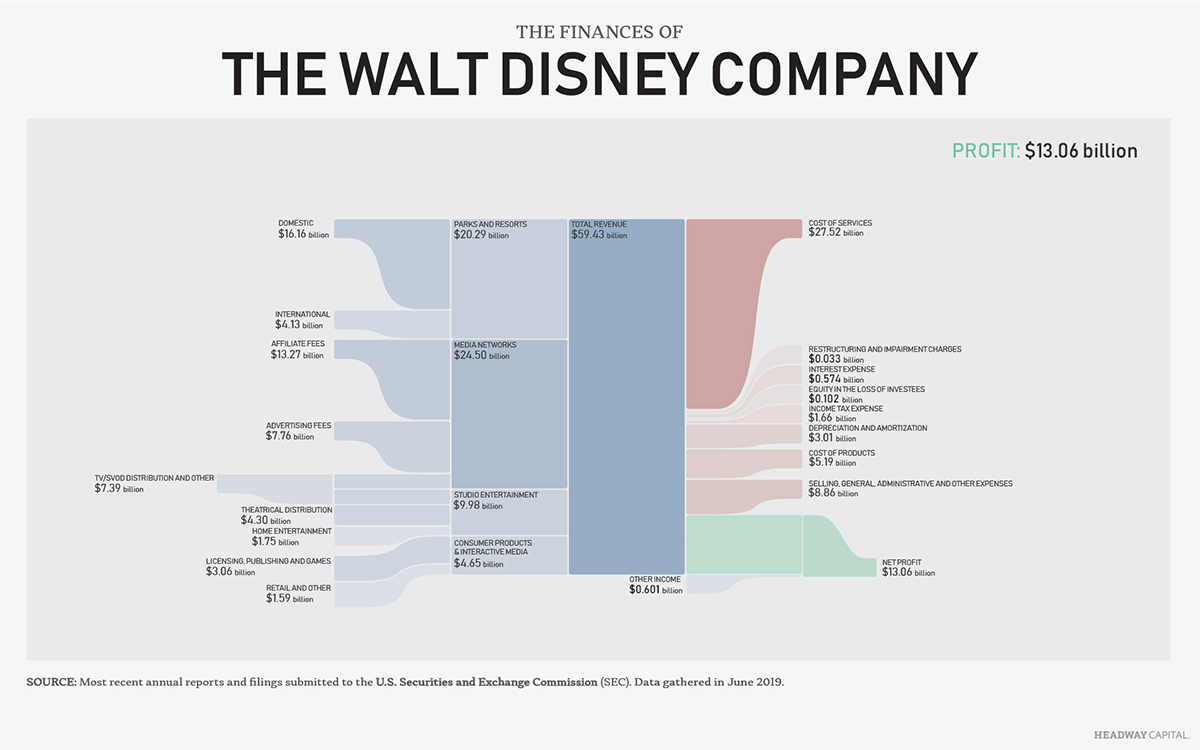
Disney has acquired a number of major media properties in the 21st century, purchasing Pixar in 2006, Marvel Entertainment in 2009, Lucasfilm in 2012, and, most recently, 21st Century Fox’s film and TV assets in March 2019. Disney is able to utilize new properties across its business segments, producing four Star Wars films since acquiring Lucasfilm and announcing four more through 2026, opening Star Wars-themed park lands at Disney World and Disneyland in 2019, and selling Star Wars merchandise throughout its Disney retail stores, for example. Other major properties majority-owned by The Walt Disney Company include ABC, ESPN, and Hulu.
How the companies ‘stack up’ against each other
It is difficult to convey the magnitude of just how much money flows in and out of some of these companies in one year. The revenue from Amazon’s subscription services segment in 2018 alone — primarily Amazon Prime memberships — amounts to a stack of one dollar bills over five million feet tall, or the Empire State Building stacked on top of itself over 4,000 times. The R&D investments Uber makes on self-driving cars and other advanced technologies amounts to a pile of one dollar bills 164,000 feet high — or nearly 300 Washington Monuments stacked on top of one another. Apple’s total sales revenue for fiscal 2018, in a vertical stack of one dollar bills, could reach about one-thirteenth of the way to the moon.
The companies on this list have collectively generated trillions of dollars in wealth and are responsible for products and services that play an important role in the lives of billions of people. Understanding how they operate is essential to understanding modern-day business, and is of importance to investors and interested readers alike.
While the shape and flow of their income statements are likely to change in the near future as they mature and enter different phases of the business cycle, they provide valuable insight into our changing economy today.
METHODOLOGY
All data is for the most recent fiscal year and came from publicly available SEC 10-K filings or annual reports. Data for Uber Technologies, Inc. came from the company’s Form S-1 filing. For the sake of simplicity and uniformity among companies, the names of several operating segments were altered slightly in the process of transcription from income statement to alluvial diagram.
SOURCES
Amazon. (2017). Amazon and Whole Foods Market Announce Acquisition to Close This Monday, Will Work Together to Make High-Quality, Natural and Organic Food Affordable for Everyone. sec.gov
Alphabet Inc. (2019). Form 10-K 2018. bamsec.com
Apple Inc. (2018). Form 10-K 2018. bamsec.com
Facebook, Inc. (2019). Form 10-K 2018. bamsec.com
Nike, Inc. (2018). Form 10-K 2018. bamsec.com
Uber Technologies, Inc. (2019). Form S-1. sec.gov
The Walt Disney Company. (2019). Fiscal Year 2018 Annual Financial Report. thewaltdisneycompany.com
Barbara Davidson
Babs is Lead Content Strategist and financial guru. She loves exploring fresh ways to save more and enjoy life on a budget! When she’s not writing, you’ll find her binge-watching musicals, reading in the (sporadic) Chicago sunshine and discovering great new places to eat. Accio, tacos!